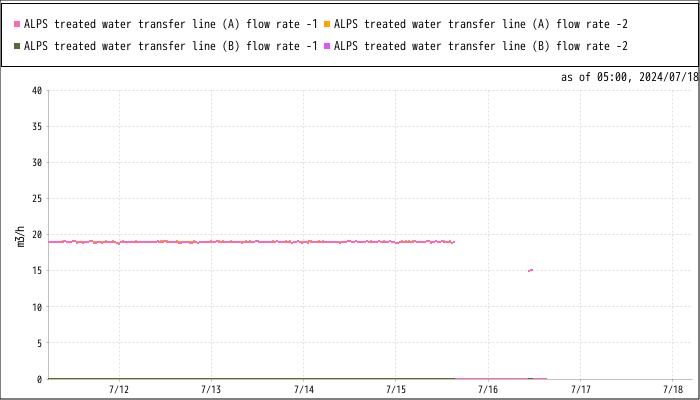
(3) ALPS treated water transfer line flow rate
- ※ The figures in the graph and the table are updated every hour.(Please push the "F5" key to update the figures.)
- ※ ALPS treated water transfer line flow rate is measured by two flow meters (flow rate 1 and 2) in each transfer line, system A and B, for reliability.
- ※ Filtrated water that is used to flush out the remaining ALPS treated water in the ALPS treated water transfer line before discharge is completed, is not counted as "Total ALPS treated water transfer line volume" but is counted as "Total ALPS treated water discharge volume (Accumulated)"shown in the table of (5).
Announcement
- Data may be missing or changed due to equipment failure, cleaning, or regular inspections.
Click here for past data
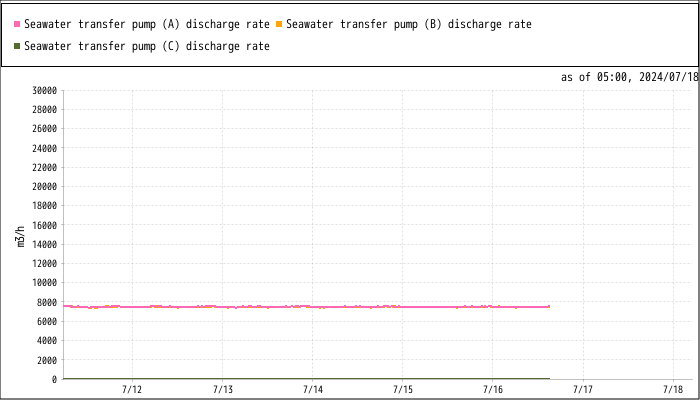
(4) Seawater transfer pump flow rate
- ※ The figures in the graph and the table are updated every hour.(Please push the "F5" key to update the figures.)
Announcement
- Data may be missing or changed due to equipment failure, cleaning, or regular inspections.
Click here for past data
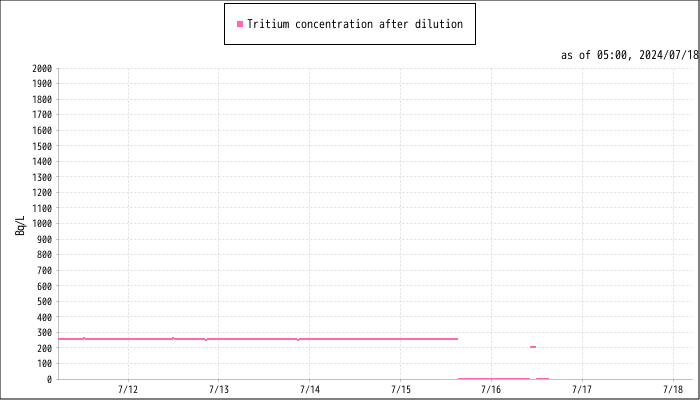
(5) Tritium concentration after dilution
- ※ The figures in the graph and the table are updated every hour. (Please push the "F5" key to update the figures.)
-
※
"Tritium concentration after dilution" is calculated by the following formula and is the conservative value considering the uncertainty in concentration measurement, etc. :
"Tritium concentration after dilution" = (Tritium concentration of ALPS treated water × ALPS treated water transfer line flow rate) / (Integrated value of seawater transfer pump discharge rate + ALPS treated water transfer line flow rate)
-
※
"Tritium concentration of ALPS treated water" in the above formula is measured by TEPCO at the measurement/confirmation facility. (Click here for details.)
The larger value of ALPS treated water transfer flow rate-1 and 2 is used ALPS treated water transfer flow rate" in the above formula.
- ※ Click here for actual value of tritium concentration analyzed daily during the discharge period.
- ※ “Total tritium discharge volume (Accumulated)” is the accumulated value to date with an annual limit of 22 trillion Bq.
-
※ "Total tritium discharge volume (Accumulated)" is the conservative value which considers the uncertainty of tritium concentration in the measurement/confirmation facility and ALPS treated water transfer line flow meters, and is calculated by the following formula:
Total tritium discharge volume (Accumulated) = Conservatively assessed tritium concentration in the measurement/confirmation facility [Bq/liter] (Note1) × Conservatively assessed discharge volume of ALPS treated water [m3] (Note2) × 1,000[liter/m3]
This value is used for Monitoring/Control Devices to control discharge volume of tritium not to exceed the annual limit.
- (Note1) Considering the uncertainty of analyses, “conservatively assessed tritium concentration" in the measurement/confirmation facility” is assumed to be 1.1times of analysis values
- (Note2) Considering the uncertainty in measurements of ALPS treated water line flow rates, “conservatively assessed discharge volume of ALPS treated water” is assumed to be higher by 0.021 times the maximum measurable value than the value indicated by the flowmeter.
Announcement
- Data may be missing or changed due to equipment failure, cleaning, or regular inspections.
Click here for past data