![]()


informaiton
Assumption
Today'selectricity demand forecast
Peak Demand
-
%
-
%
Peak Usage
-
%
-
%
-
Stable
Less than 92%
-
Tight
92%- Less than 97%
-
Very Tight
97% or higher
Today's electricity demand
-
%
-
%
-
%
-
%
-
Stable
Less than 92%
-
Tight
92%- Less than 97%
-
Very Tight
97% or higher
*For the wide area block, different colors are used to indicate the degree of strain on supply-demand. This assessment is based on consumption rates.
Assumption
Today'selectricity demand
Peak Demand
-
%
-
Peak demand
x10 MW
Supply Capability
x10 MW
Peak Usage
-
%
-
demand
x10 MW
Supply Capability
x10 MW
Today’s electricity demand
Actual
-
%
-
Actual demand
x10 MW
Supply Capability
x10 MW
-
%
-
Actual demand
x10 MW
Supply Capability
x10 MW
Forecast
The hourly electricity demand forecast is not posted.
*It will be posted when there is a request from the government for conserving energy.
-
%
-
Demand forecast
x10 MW
Supply Capability
x10 MW
(updated at 14:50,
provisional)
x10 MW


-
Current demand
(updated at , provisional)x10 MW
-
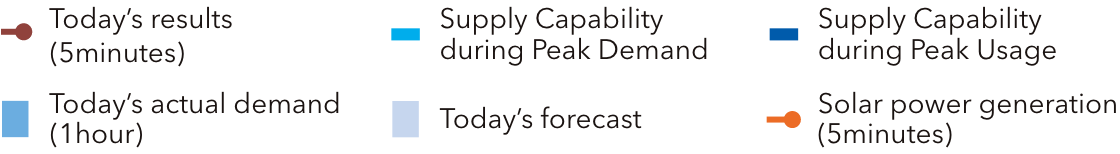
Solar Power
Solar power generation Rate of use
- *"Tokyo area" refers to the Kanto region (Tokyo Metropolis, Kanagawa Prefecture, Saitama Prefecture, Chiba Prefecture,Tochigi Prefecture, Gunma Prefecture, Ibaraki Prefecture, Yamanashi Prefecture and Shizuoka Prefecture (east of Fujikawa)) for which power is supplied by TEPCO Power Grid.
- *<The calculation method of consumption rate> The consumption rate is calculated by dividing the total electricity consumption (total demand) by available electricity (total supply). (Click here to see the calculation formula.)
Calendar of actual
maximum demand
in the past
(Tokyo area)
Information March 28, 2019
- December 1, 2018 Since December 1, 2018, our website has started offering power utilization forecasts of peak time zones when power utilization is at a maximum and supply becomes tight because of high demand.
- April 1, 2016 As full liberalization of the electricity retail market began in April 2016, TEPCO Electricity Forecast shows electricity demand and supply in the service area, including not only TEPCO Group but also other electric power companies.
- HOME
- Electricity forecast