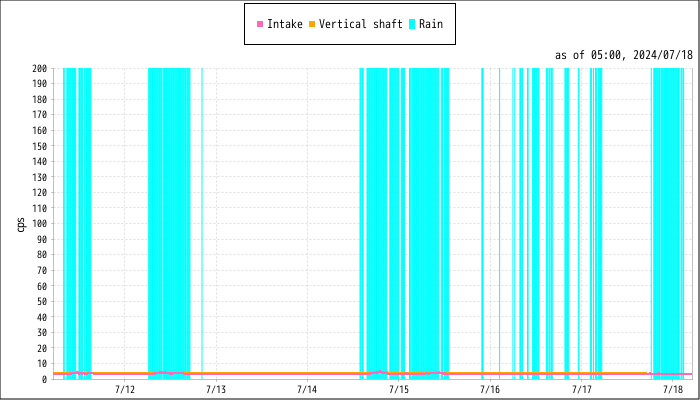
(1) Intake/Vertical shaft monitor
- ※ The figures in the graph and the table are updated every 10 minutes.(Please push the "F5" key to update the figures.)
- ※ The measurement results from the intake monitor may vary due to the effects caused by seabed sand and when they are stirred up by rainfall or rough seas.
- ※ Vertical shaft monitor readings may temporarily increase when the water level in the shaft decreases after discharge has been suspended.
-
※Monitor readings vary depending on the differences in the environments (background radiation) surrounding the monitors.
The purpose of installing the monitors is not comparing the differences between monitor readings but checking to see whether there have been significant fluctuations in the readings of each monitor.
-
※Even if the same specimens are measured with the same type of monitors, there will still be a certain degree of measurement error in the readings.
The smaller the value being measured, the more pronounced the error tends to be.
Announcement
- Data may be missing or changed due to equipment failure, cleaning, or regular inspections.
Click here for past data
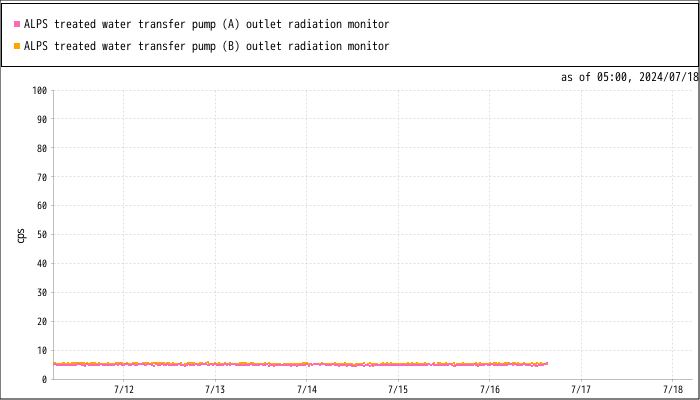
(2) ALPS treated water transfer pump outlet radiation monitor
- ※ The figures in the graph and the table are updated every hour.(Please push the "F5" key to update the figures.)
Announcement
- Data may be missing or changed due to equipment failure, cleaning, or regular inspections.
Click here for past data