


How to see
"Electricity forecast"
The objective of "Electricity forecast" is to provide easy-to-understand information on the status of electricity demand and our actual supply capacity.
Consumption rates for the wide area block and the Tokyo area can be viewed here.


Wide area block usage
Here you can see today's power consumption forecast for the wide areacross-regional block as well as today's actual power consumption.
*Wide area block is represented the wide area to which the balancing group of power generation and the balancing group of demand with the same wide area's reserve rate , when adjustment power is procured in a wide area(within the range without interconnected lines congestion).
Wide area block electricity use (unlike area consumption rate) represents consumption in multiple areas that belong to the same wide area block.
The time of peak demand represents time when total(9 areas) demand nationwide is maximized.
Peak consumption rate time represents time when consumption rate is maximized in wide area blocks belonging to the Tokyo area.
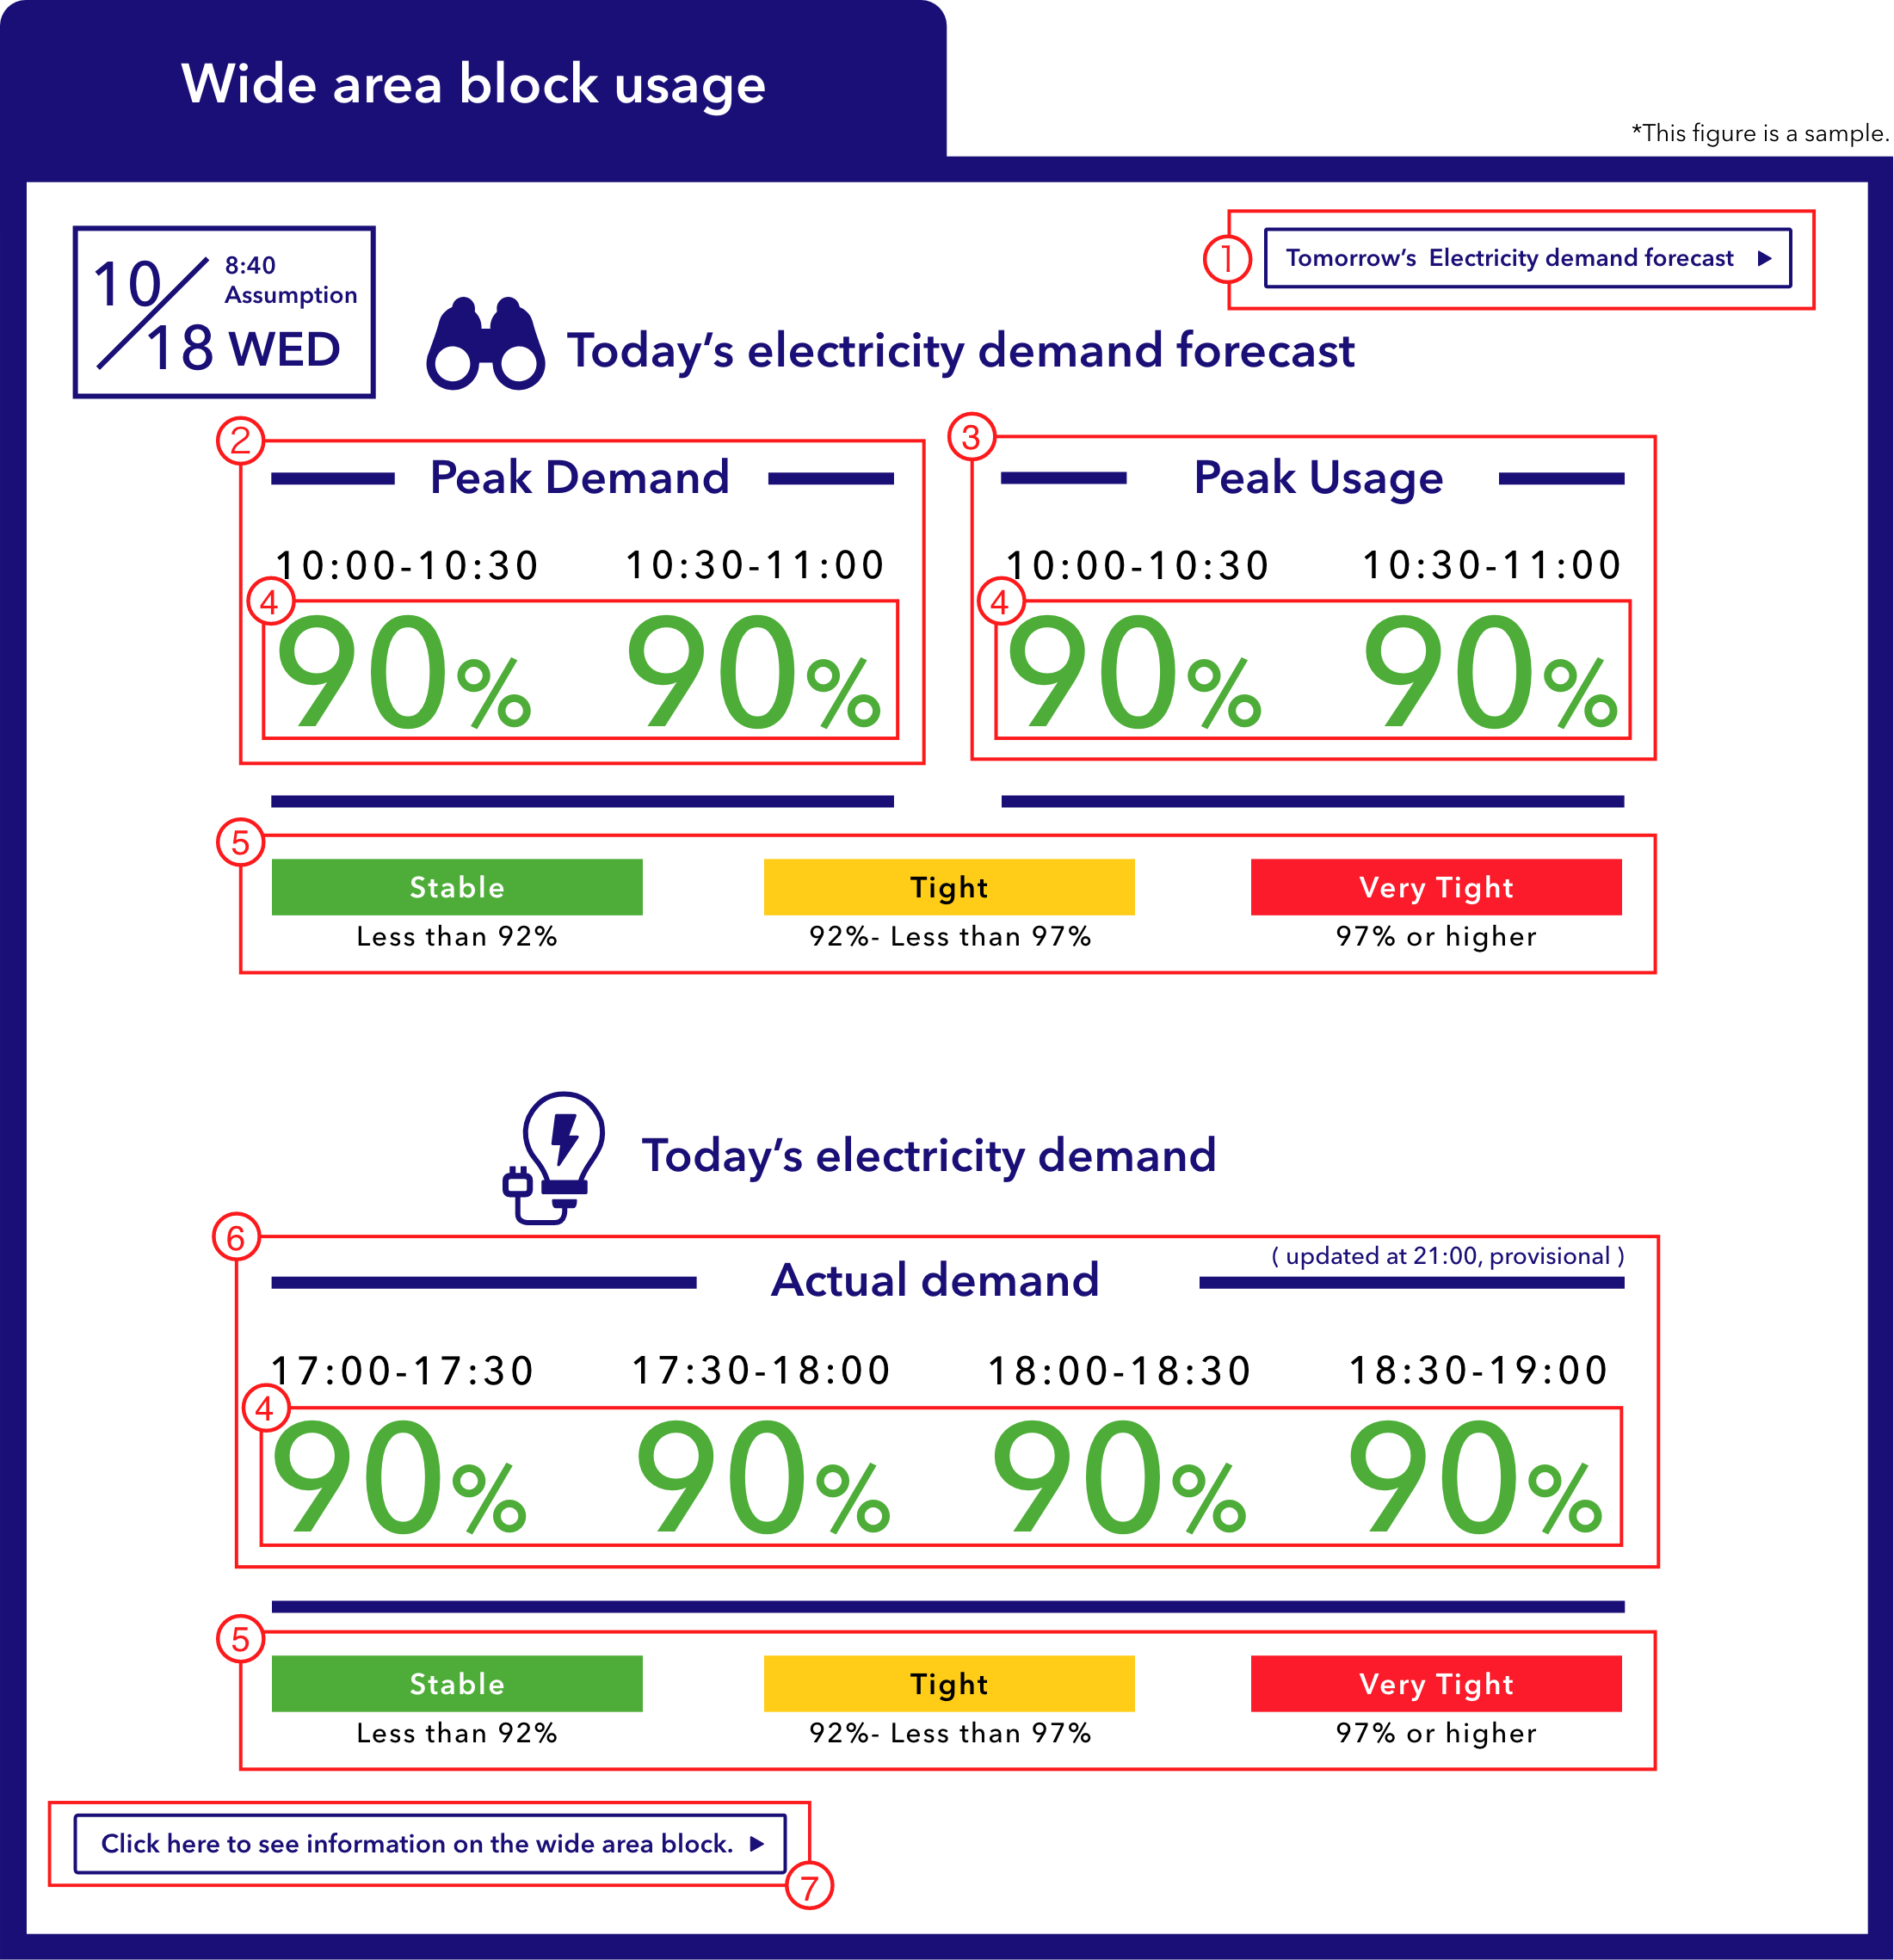
- 1 Click the link to see the power consumption forecast for the next day (after 6 PM)
- 2 The time of peak demand is the peak demand time for the entire country (9 areas). Numbers are updated every 30 minutes.
- 3 Peak consumption rate time is the peak consumption rate time for the wide area block of which the Tokyo area is a part of.
-
4
⟨The calculation method of consumption rate⟩
The consumption rate is calculated by dividing the total electricity consumption (total demand) by available electricity (total supply).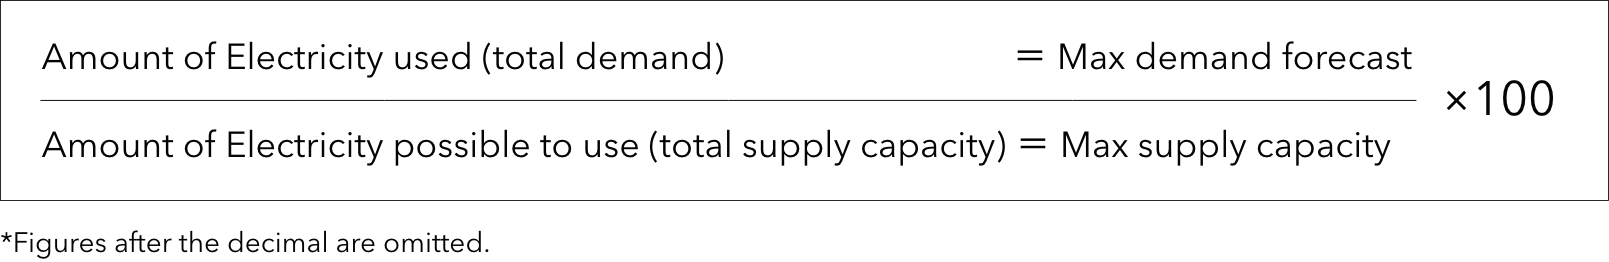

- 5 For the wide area block, different colors are used to indicate the degree of strain on supply-demand. This assessment is based on consumption rates.
- 6 Actual power consumption statistics are indicated in 30 minute intervals.
- 7 Click the link to visit the website of the Organization for Cross-regional Coordination of Transmission Operators, Japan(https://www.occto.or.jp/)
Tokyo area usage
Click here to see today's power consumption forecast and today's actual power consumption in the Tokyo area. *"Tokyo area" refers to the Kanto region (Tokyo Metropolis, Kanagawa Prefecture, Saitama Prefecture, Chiba Prefecture,Tochigi Prefecture, Gunma Prefecture, Ibaraki Prefecture, Yamanashi Prefecture and Shizuoka Prefecture (east of Fujikawa)) for which power is supplied by TEPCO Power Grid.
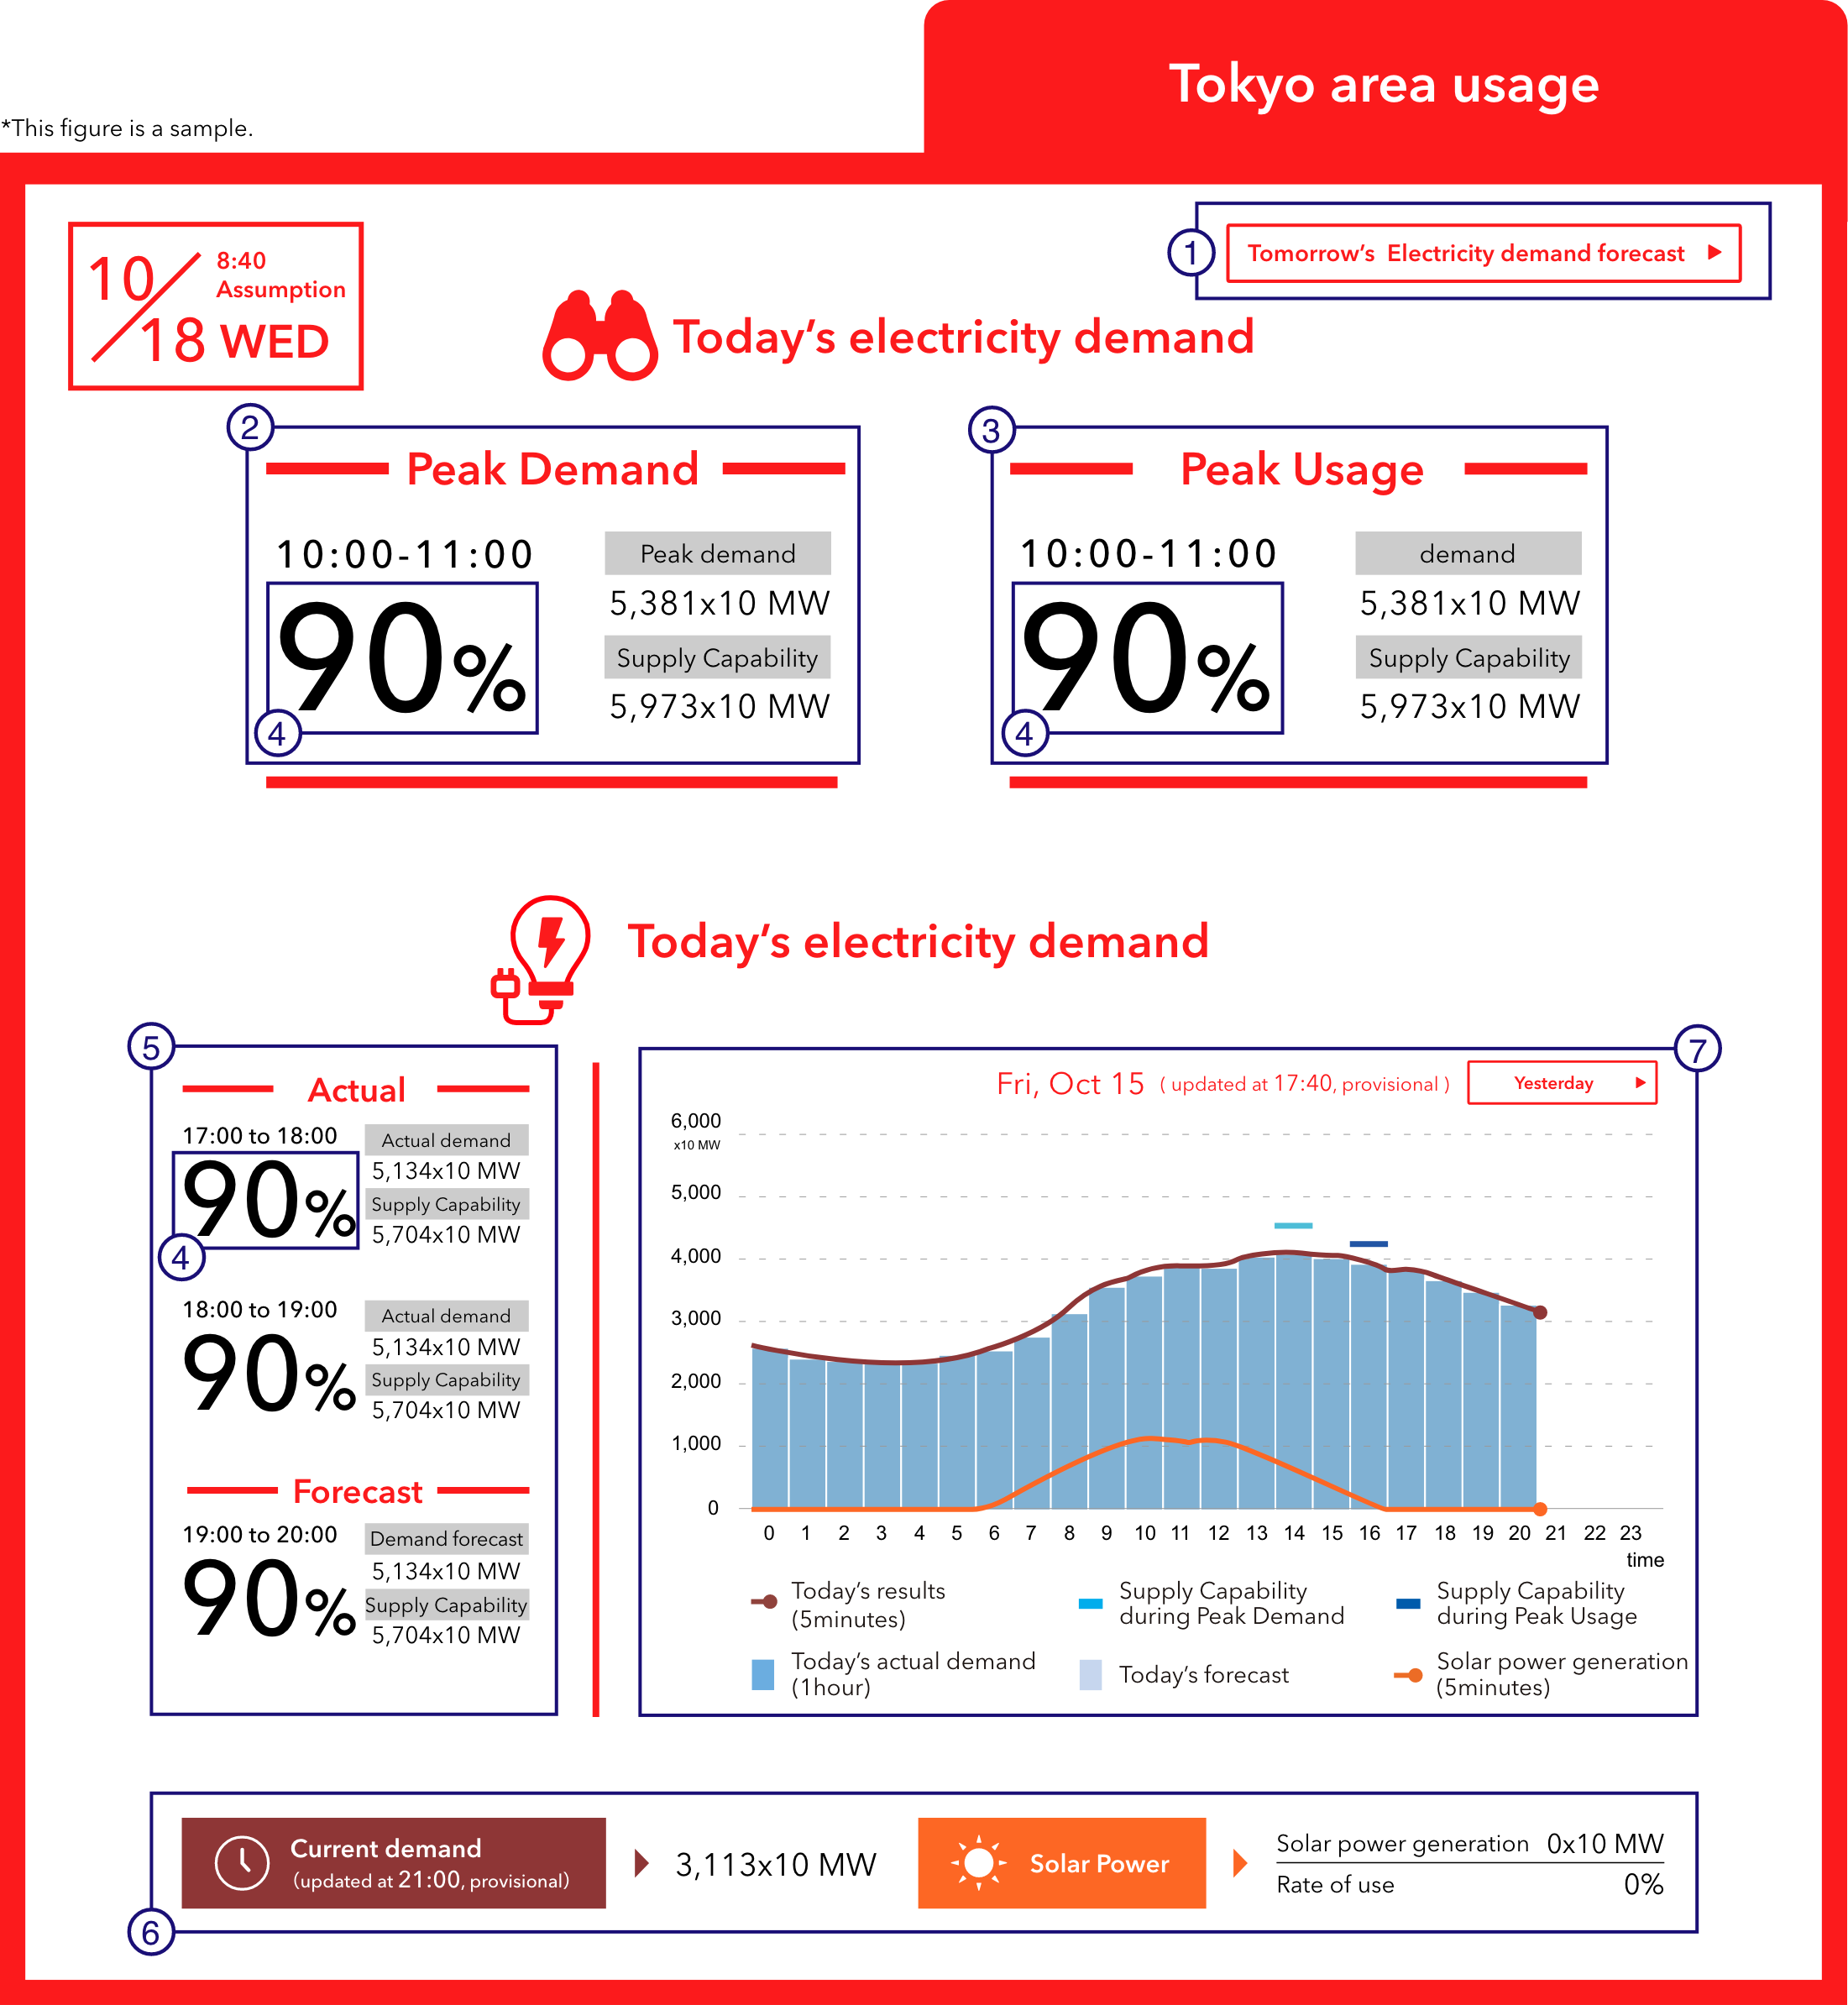
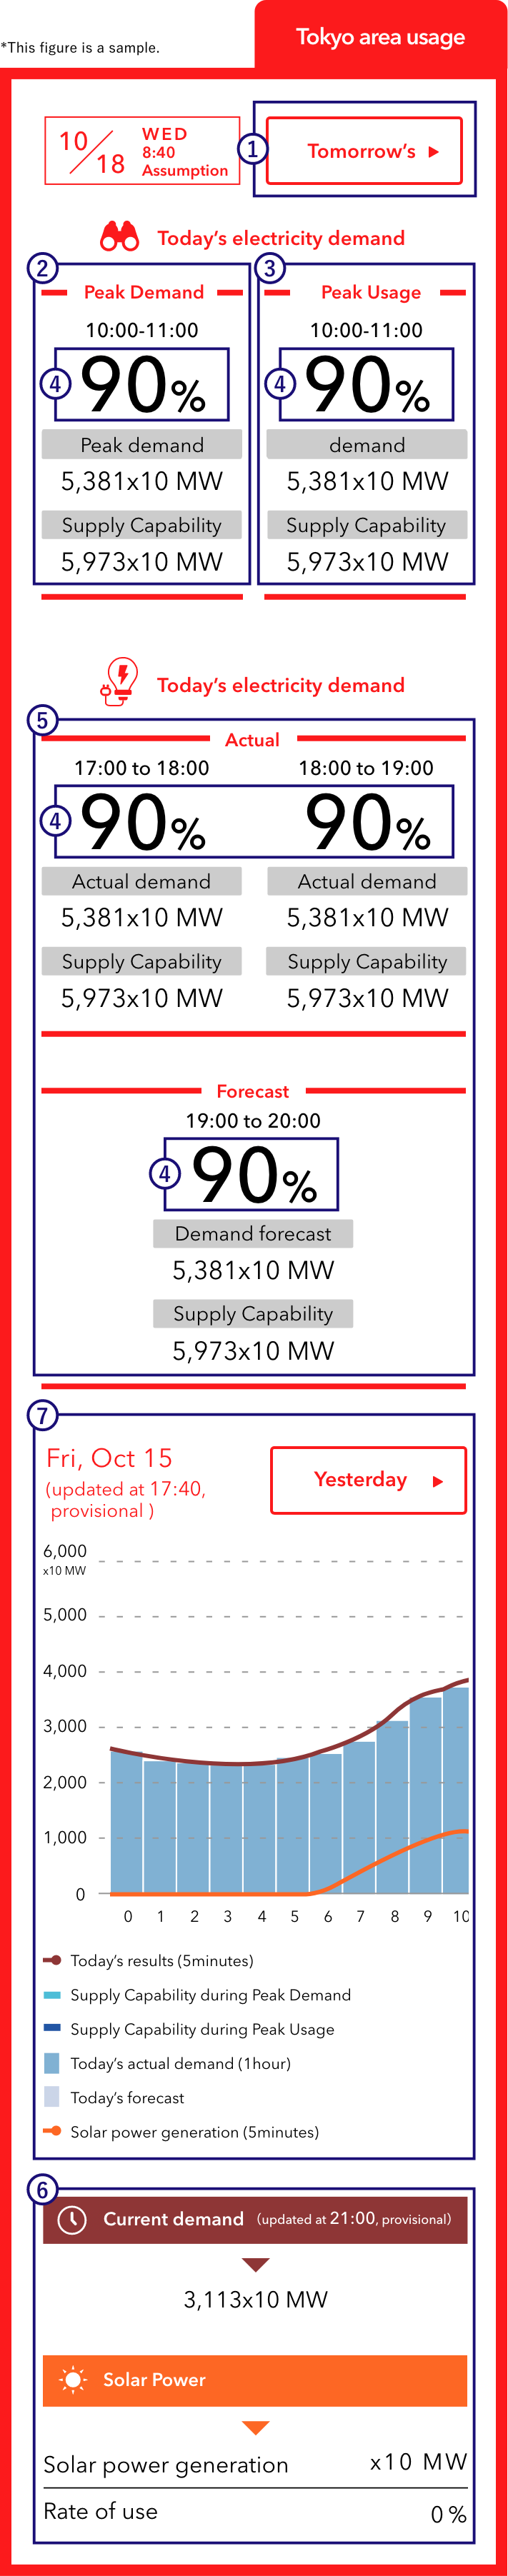
- 1 Click the link to see the power consumption forecast for the next day (after 6 PM)
- 2 The time of peak demand is the peak demand time for the entire country (9 areas). Numbers are updated every 30 minutes.
- 3 Peak consumption rate time is the peak consumption rate time for the wide area block of which the Tokyo area is a part of. Numbers are updated every 30 minutes.
-
4
⟨The calculation method of consumption rate⟩
The consumption rate is calculated by dividing the total electricity consumption (total demand) by available electricity (total supply).
- 5 Power consumption forecasts and actual values are shown in one hour intervals.
- 6 This is the current actual power consumption and the actual amount of solar power generated.
- 7 Daily consumption status is shown in a graph. You can also check the comparison to the figure from the day before.
*This figure is a sample.
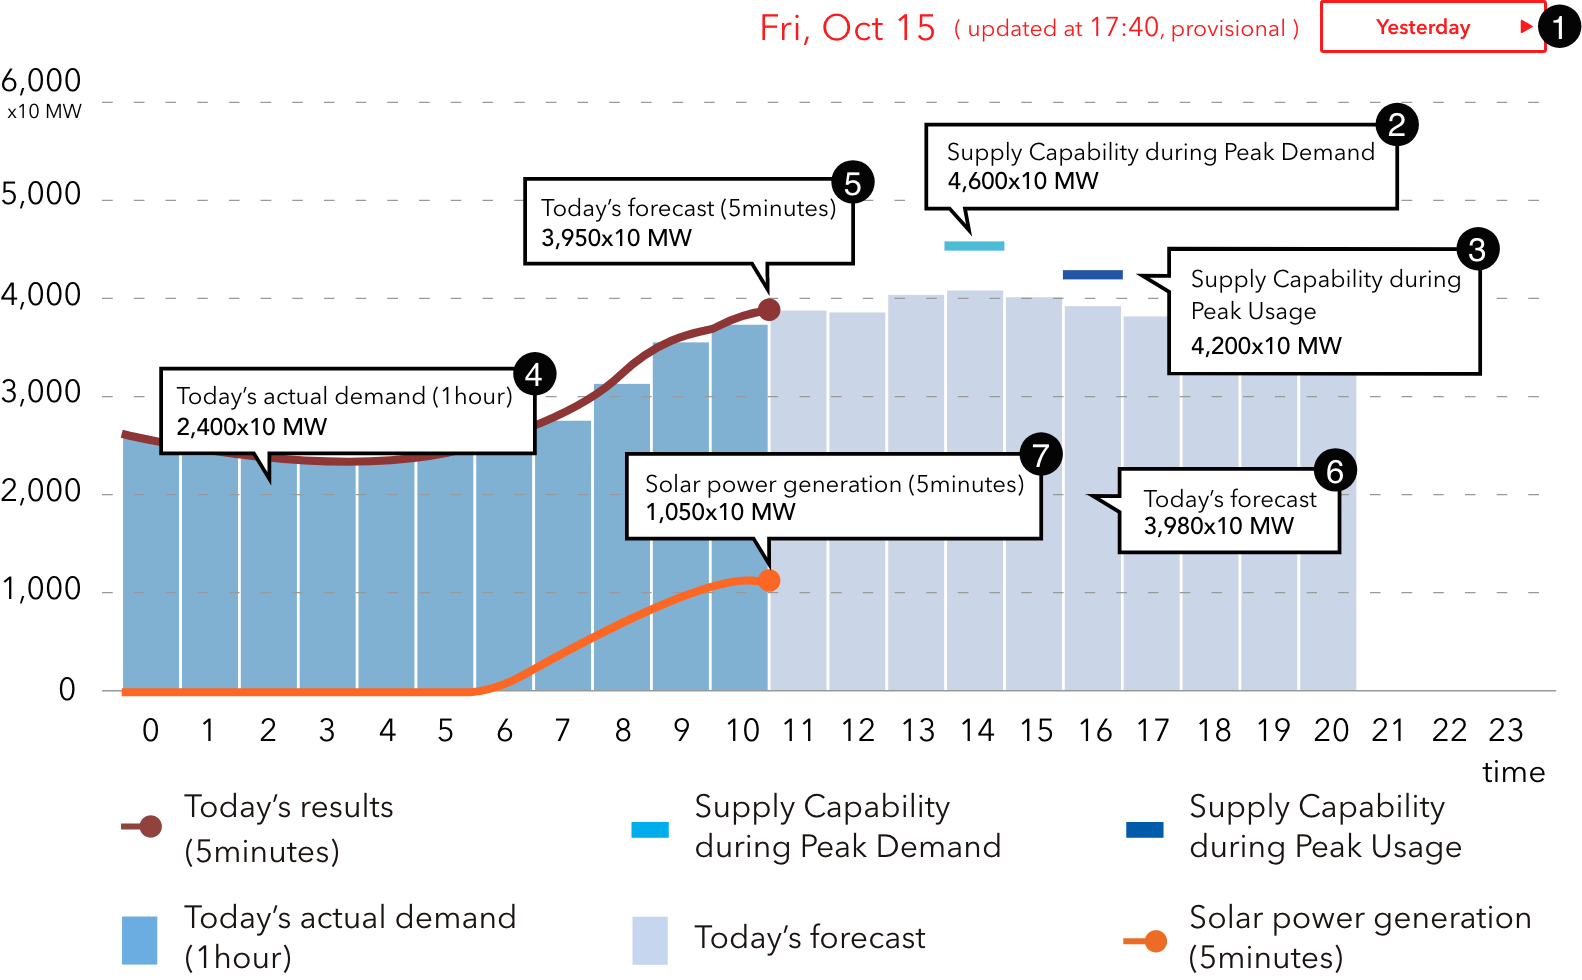
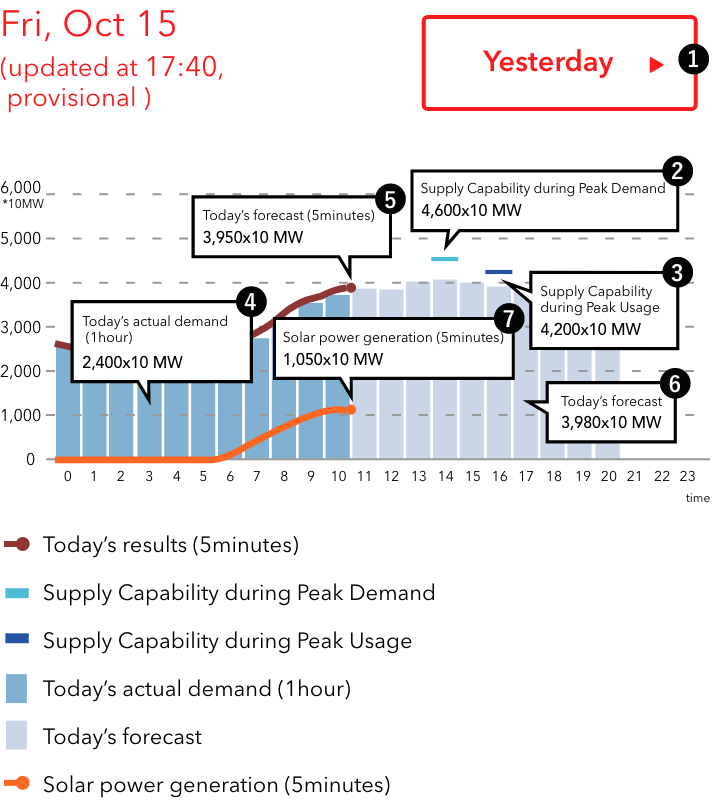
-
1
Yesterday's actual demand
When you click the button, you can see the line graph. -
2
Supply capability during peak demand
The supply capacity of the time zone where the demand expected in one day is the largest. -
3
Supply capability during peak usage
The supply capacity of the time zone where the usage rate expected in one day is the largest. -
4
Today's actual power consumption (1 hour intervals)
Hourly electricity consumption actual demands are shown in a graph. -
5
Today's actual power consumption (five-minute intervals)
Electricity consumption actual demands (provisional), which are updated every 5 minutes are shown. -
6
Power consumption forecast
The graph shows the hourly power consumption forecast. -
7
Solar power generation (5 minutes)
Solar power generation data are figures for across our service area, including estimates based on solar radiation.