As of the end of FY2023
(Unit: billion yen)
| FY | Total Cost of Products Procurement (a) |
Import Cost of Overseas Products (b) |
Import Ratio (%) (b)/(a) |
|---|---|---|---|
| 1992 | 736.7 | 14.0 | 1.9 |
| 1993 | 877.4 | 21.6 | 2.5 |
| 1994 | 756.4 | 67.5 | 8.9 |
| 1995 | 759.0 | 48.0 | 6.3 |
| 1996 | 749.5 | 24.6 | 3.3 |
| 1997 | 696.4 | 47.1 | 6.8 |
| 1998 | 650.7 | 38.7 | 5.9 |
| 1999 | 595.8 | 42.2 | 7.1 |
| 2000 | 599.9 | 38.2 | 6.4 |
| 2001 | 479.3 | 18.1 | 3.8 |
| 2002 | 423.2 | 22.8 | 5.4 |
| 2003 | 364.2 | 19.2 | 5.3 |
| 2004 | 372.6 | 18.9 | 5.1 |
| 2005 | 347.6 | 18.9 | 5.4 |
| 2006 | 354.7 | 30.2 | 8.5 |
| 2007 | 351.4 | 26.9 | 7.7 |
| 2008 | 331.4 | 52.0 | 15.7 |
| 2009 | 322.7 | 28.9 | 9.0 |
| 2010 | 353.9 | 13.0 | 3.7 |
| 2011 | 537.7 | 48.0 | 8.9 |
| 2012 | 532.7 | 43.1 | 8.1 |
| 2013 | 313.7 | 19.9 | 6.3 |
| 2014 | 432.8 | 15.9 | 3.7 |
| 2015 | 426.7 | 25.3 | 5.9 |
| 2016 | 323.4 | 17.5 | 5.4 |
| 2017 | 326.6 | 32.8 | 10.0 |
| 2018 | 363.9 | 10.5 | 2.9 |
| 2019 | 231.8 | 10.2 | 4.4 |
| 2020 | 270.2 | 9.74 | 3.6 |
| 2021 | 207.7 | 4.21 | 2.0 |
| 2022 | 249.9 | 4.58 | 1.8 |
| 2023 | 280.1 | 11.08 | 4.0 |
(Note)
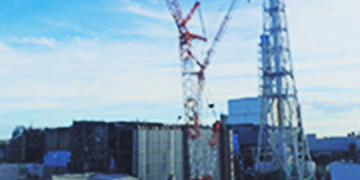
- FY2011 and FY2012: procurement cost increased due to the restoration of Fukushima Daiichi Power Station, etc.


